
Schedule Quality Management and risk reduction for construction projects. Secure your data quality and schedule reliability with automated checks.
Calendula is your partner for Schedule Quality Management in construction. While quality assurance (QA) is standard in many areas of construction, the schedule is often neglected. Calendula closes this gap and integrates schedule planning into your risk management. As a specialized service, Calendula continuously checks the quality of your planning data throughout the entire course of the project — so the schedule forms a reliable basis for steering and decision-making.
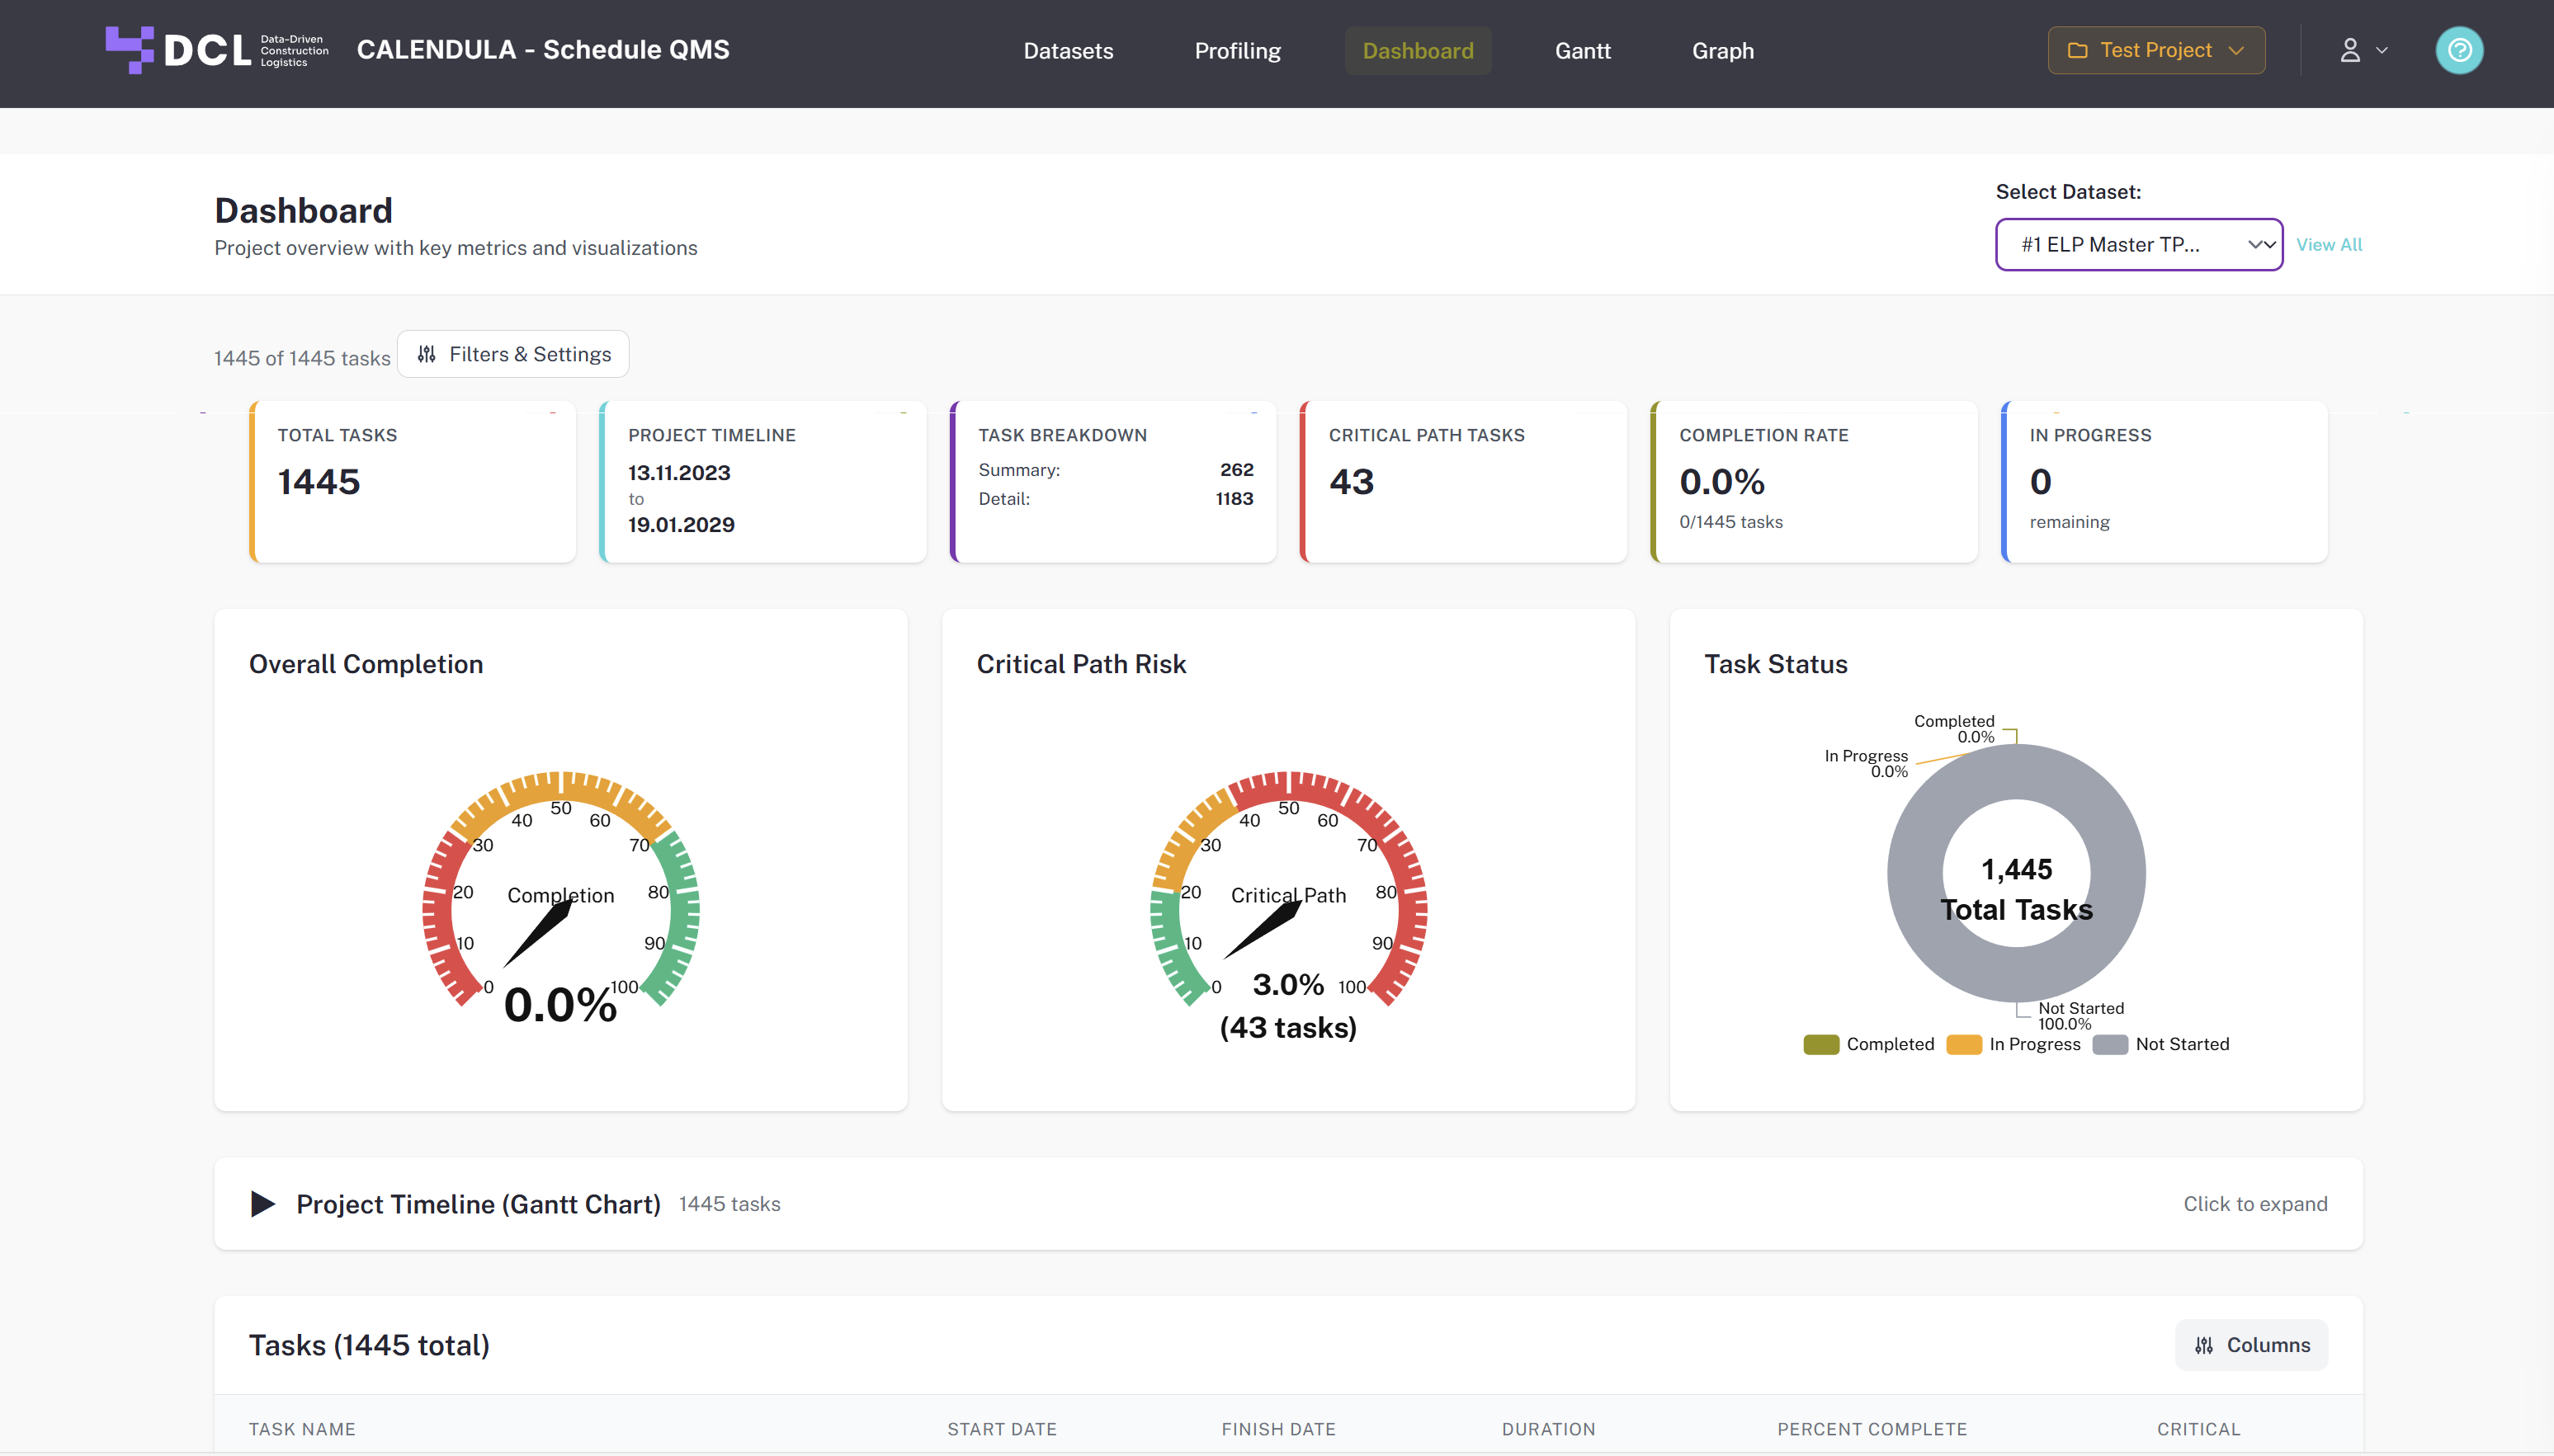
Keep track with interactive dashboards. Visualize progress, analyze the critical path, and find tasks by WBS structures or time periods. All important key figures (KPIs) are instantly at your fingertips.
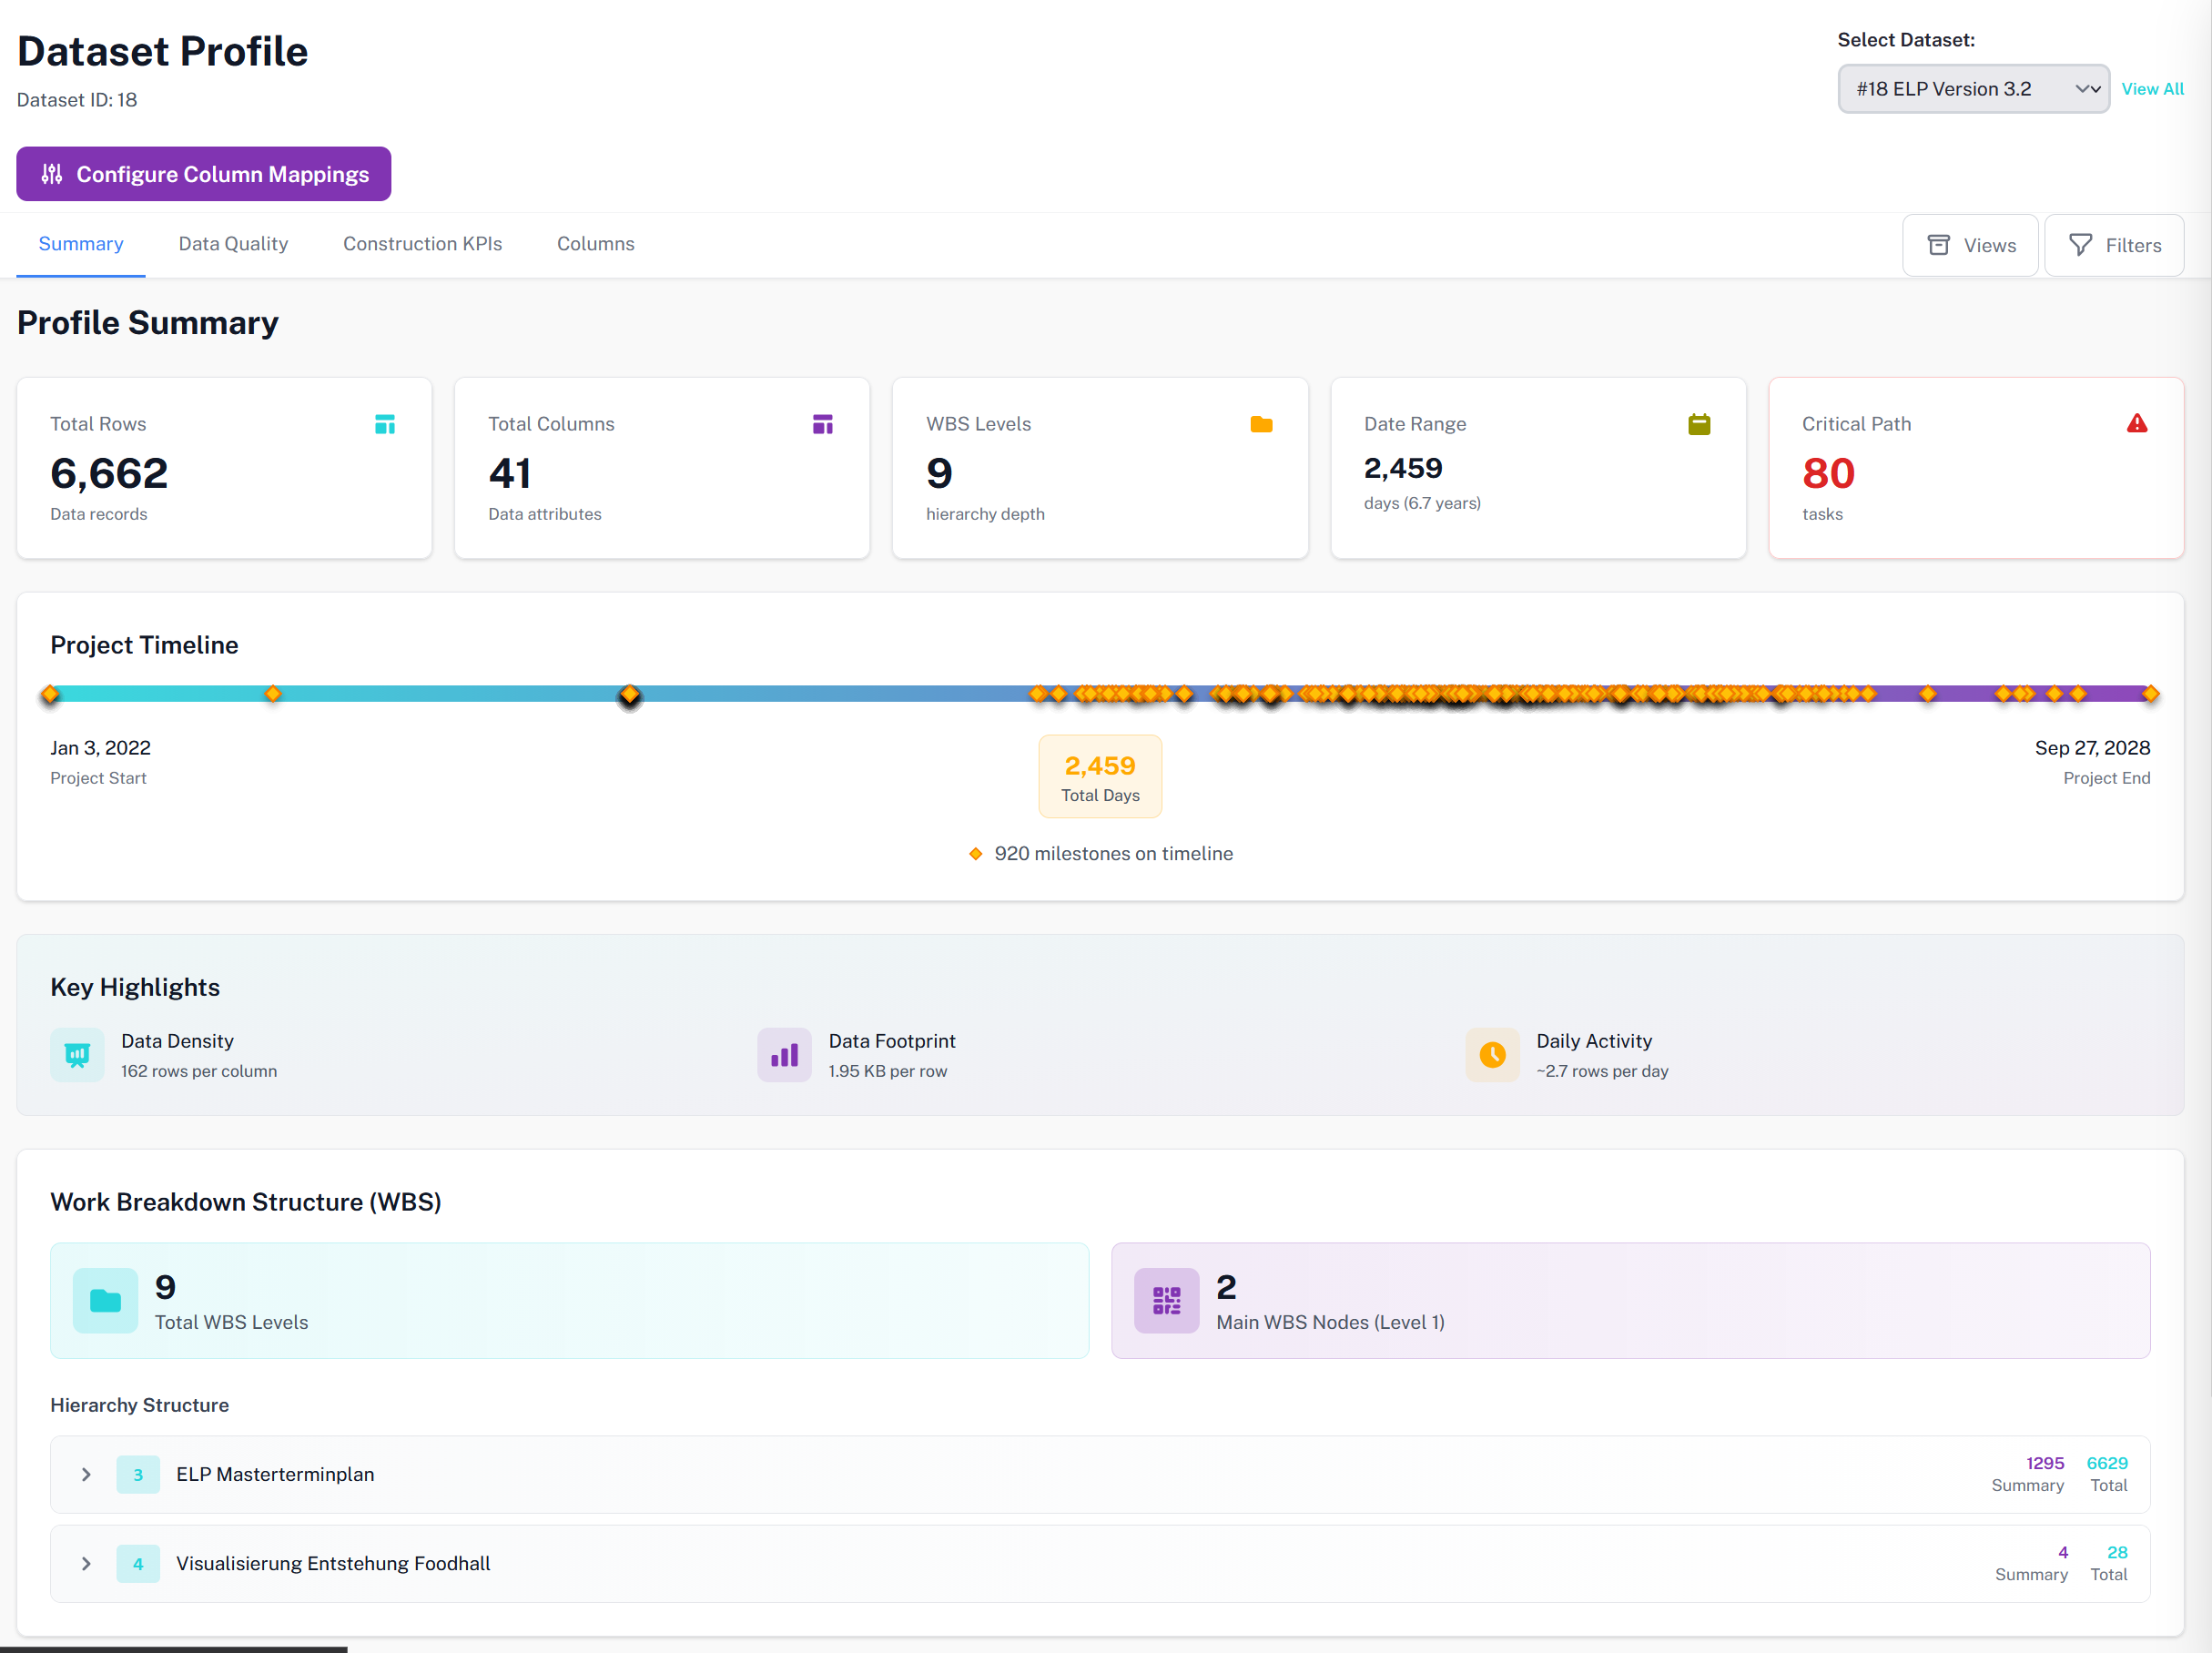
Secure the integrity of your schedules. Calendula automatically checks your data for logic errors, missing dependencies, and structural weaknesses — an indispensable tool for risk reduction.
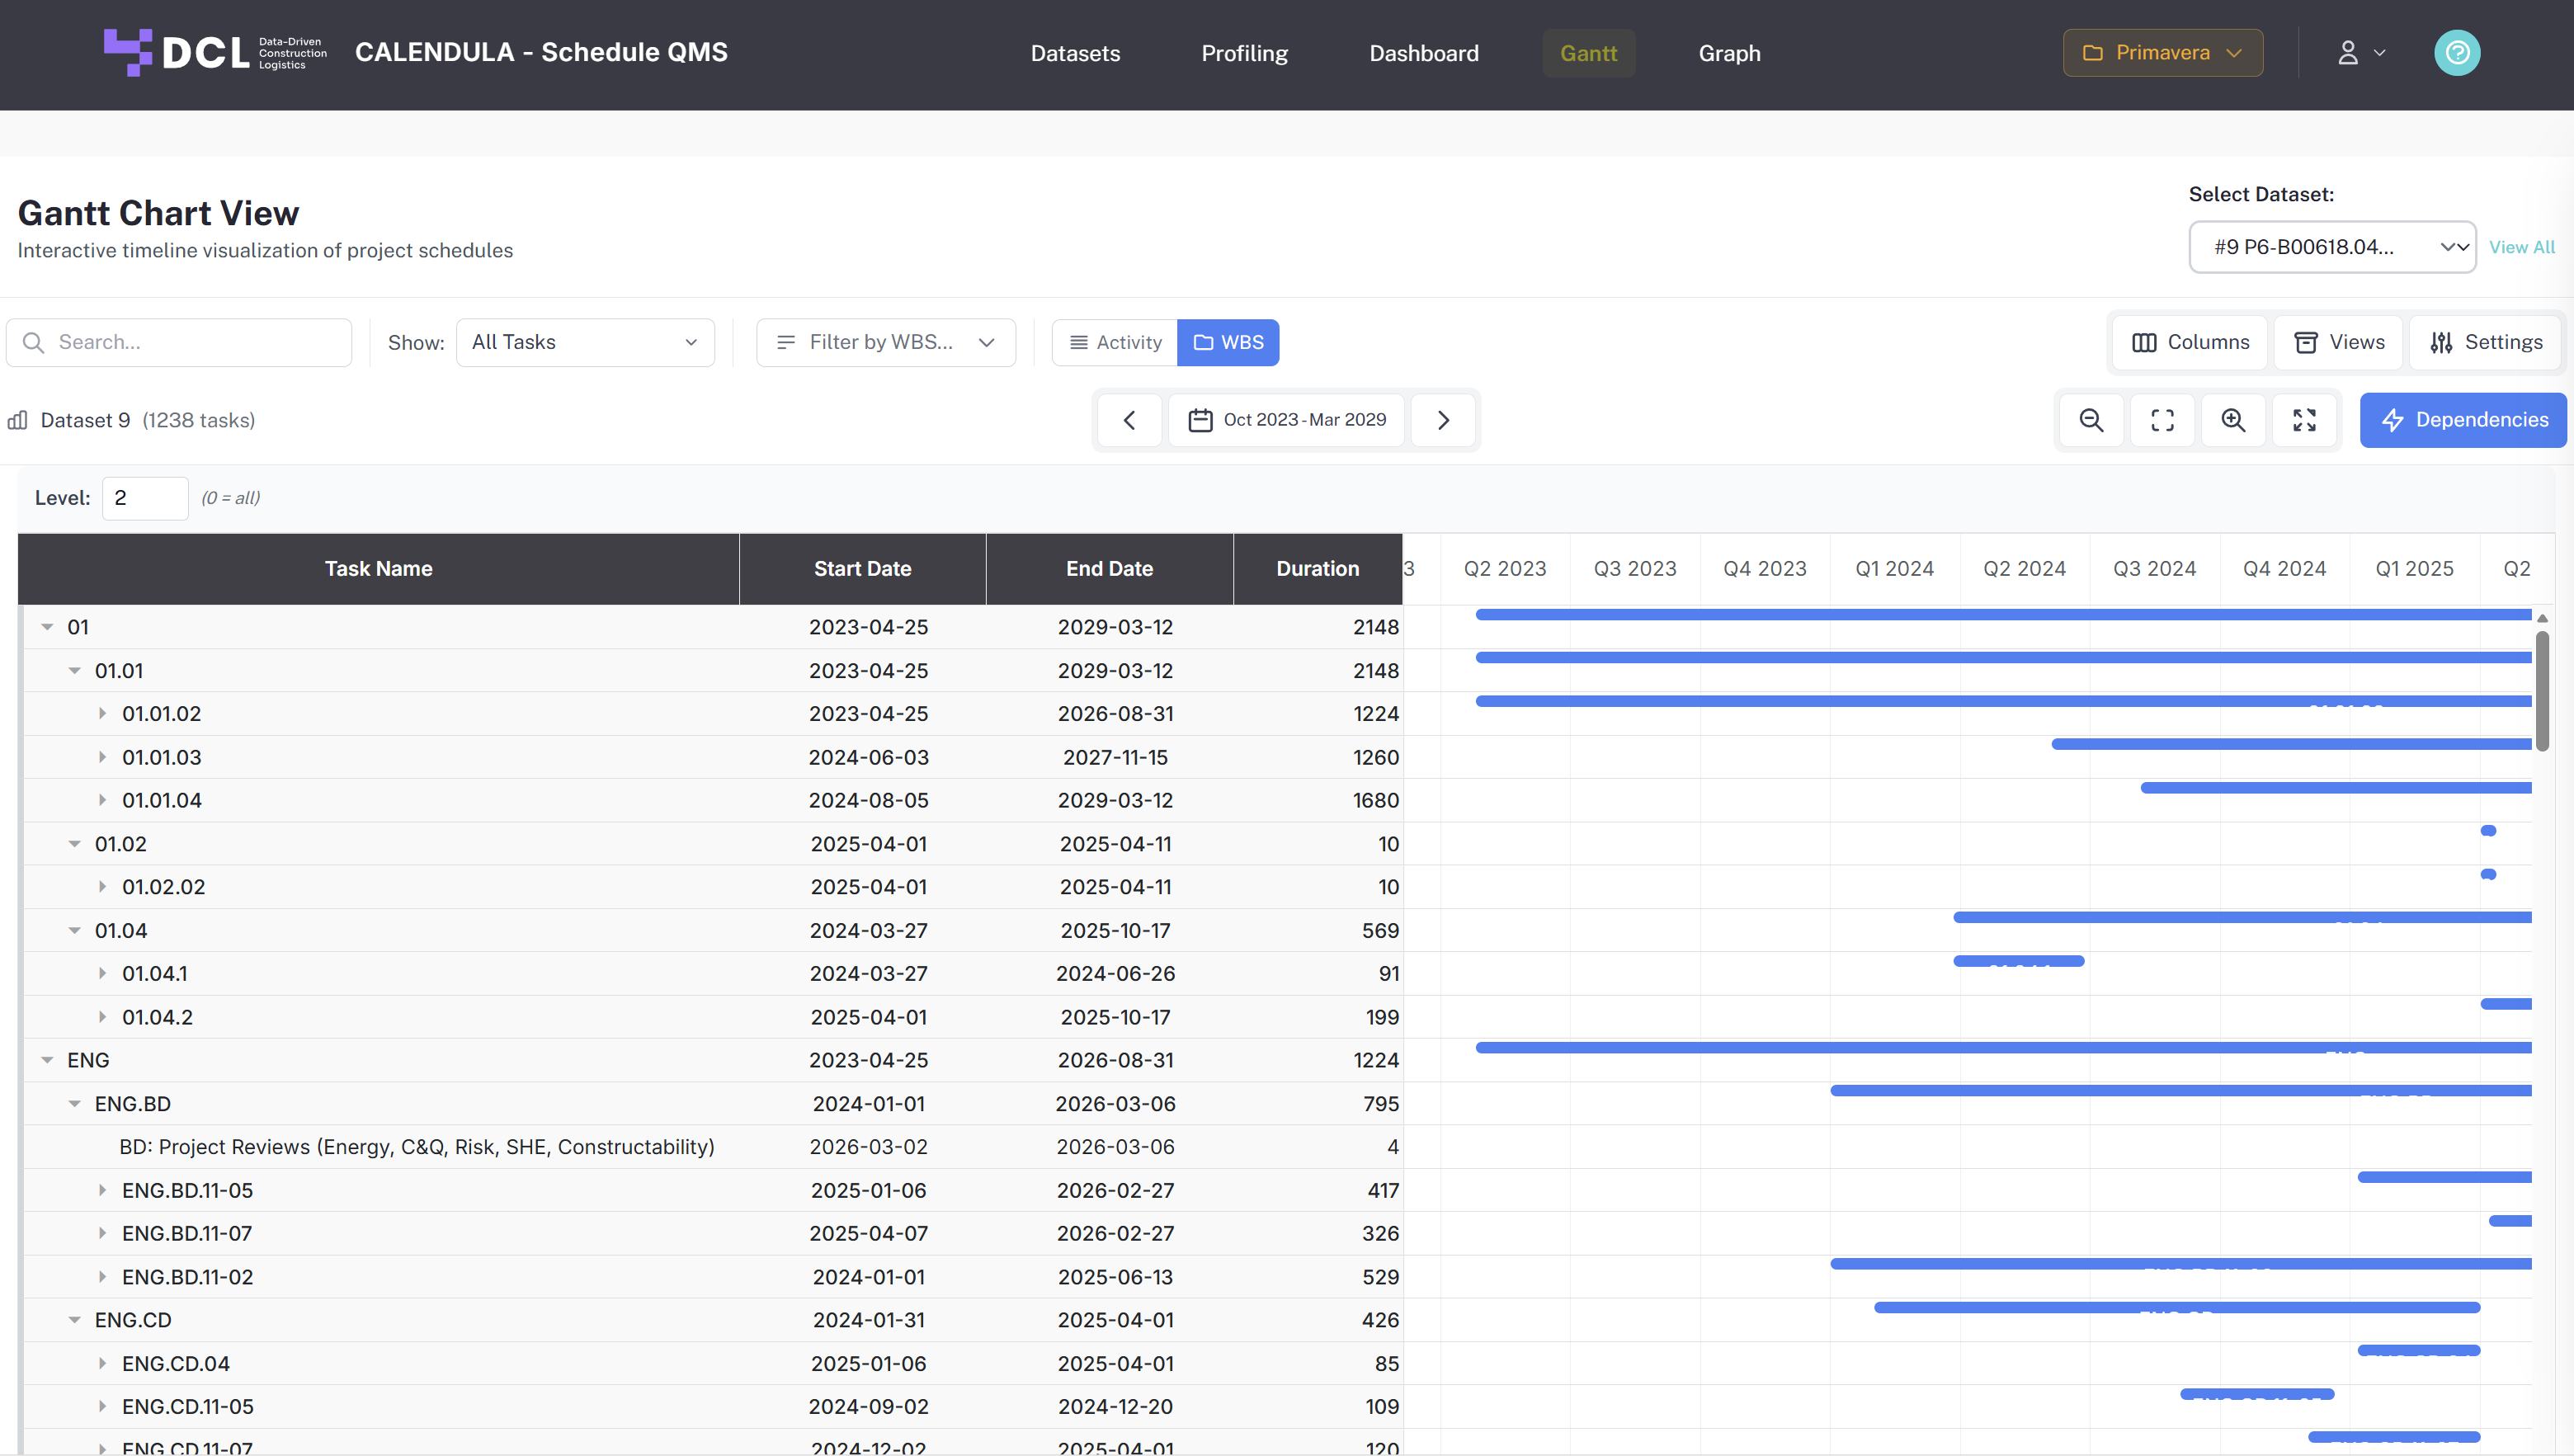
The interactive timeline offers intuitive navigation through your project history. Search for specific tasks, zoom into details, or filter specifically for critical activities — keep the hierarchy of your project in view at all times.
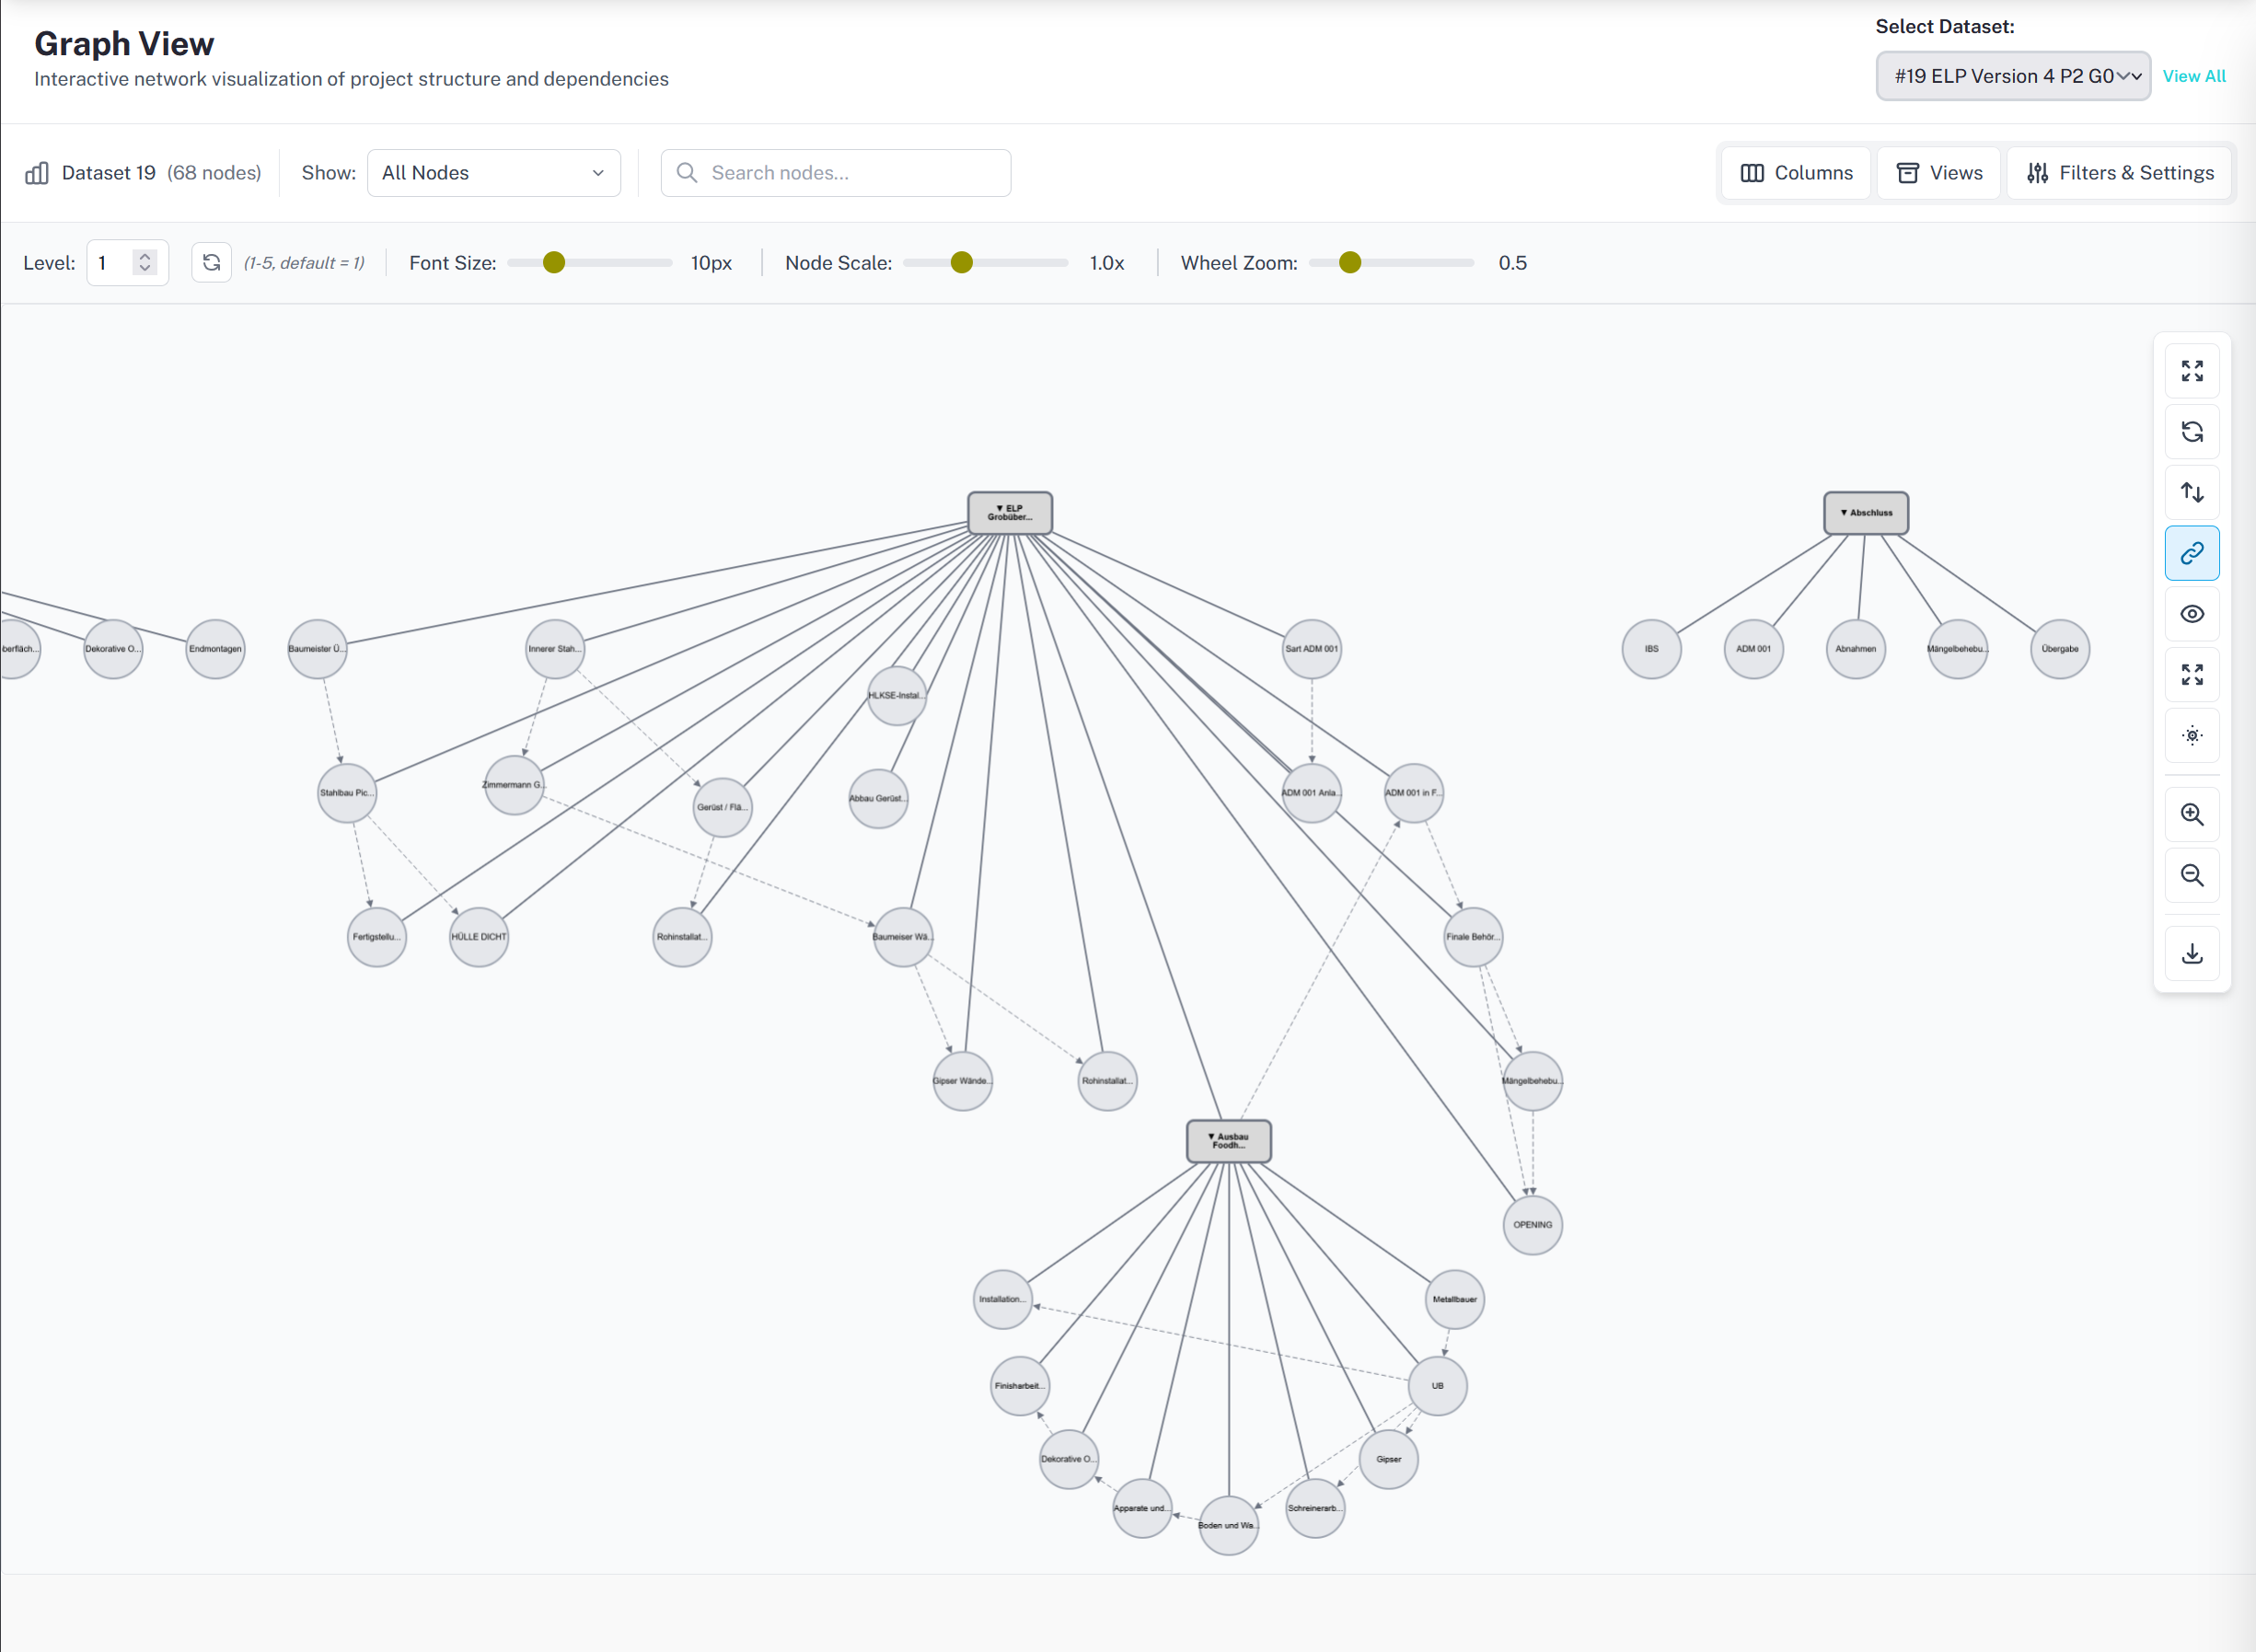
Explore the WBS structure as an interactive network. The graph view makes dependencies and hierarchical relationships visible that often remain hidden in classic tables. Recognize critical paths and identify critical work.
Getting started takes just a few minutes — no installation, no interface projects. Upload your planning data and gain insights instantly.
Upload your project schedules in Excel (.xlsx, .xls) or CSV format. Calendula supports various data formats.
Link your columns to the system fields (start date, end, WBS, etc.). Our intelligent assistant guides you through it.
Start analyzing immediately. Use dashboards, Gantt charts, and graphs for your reporting.
Getting started takes just a few minutes — no installation, no interface projects. Upload your planning data and gain insights instantly.